As long term readers of this blog might remember, I am involved with the theatre and have built electronics-driven stage props before. However, the last time I used an Arduino to drive an H-bridge IC for a stepper motor, so pretty much low level electrical engineering, with a bit of Arduino coding.
This semester however, I'm involved in a play with the Provisional Players, a student theatre group at the University of Tübingen. The play is Around the World in 80 Days, our own adaption of the novel by Jules Verne. And as the protagonists are traveling around the world, their progress is tracked by moving dots on a world map. The map is fairly large, about 2 meters wide, and we're using about 150 LEDs to mark the red dots. Naturally, driving 150 LEDs directly from a single microcontroller would require 150 outputs, so that was out of the question. Phileas Fogg and Passepartout only travel into one direction, though, so pretty soon we had the idea to use shift registers to turn on LEDs instead. To control the shift registers, we wanted a straightforward interface, because we'll only have one technician handle lights, sound and the world map during the show, and we wanted to make her life as easy as possible. The prototype set-up that I just got to work (with a couple of days to spare, go me!) looks like this:

In the beginning of the project, it wasn't very clear how we would drive the LEDs, so having 60 GPIO pins available sounded like a smart idea. I decided to use a BeagleBone Black (BBB) that I had lying around after almost demoing it at the SambaXP conference in May. As I didn't build the circuits around the shift register, I won't dwell on that topic. What I want to talk about a bit more is the software side of things. The task of the system is to run LEDs that illustrate the protagonists' travels around the world.
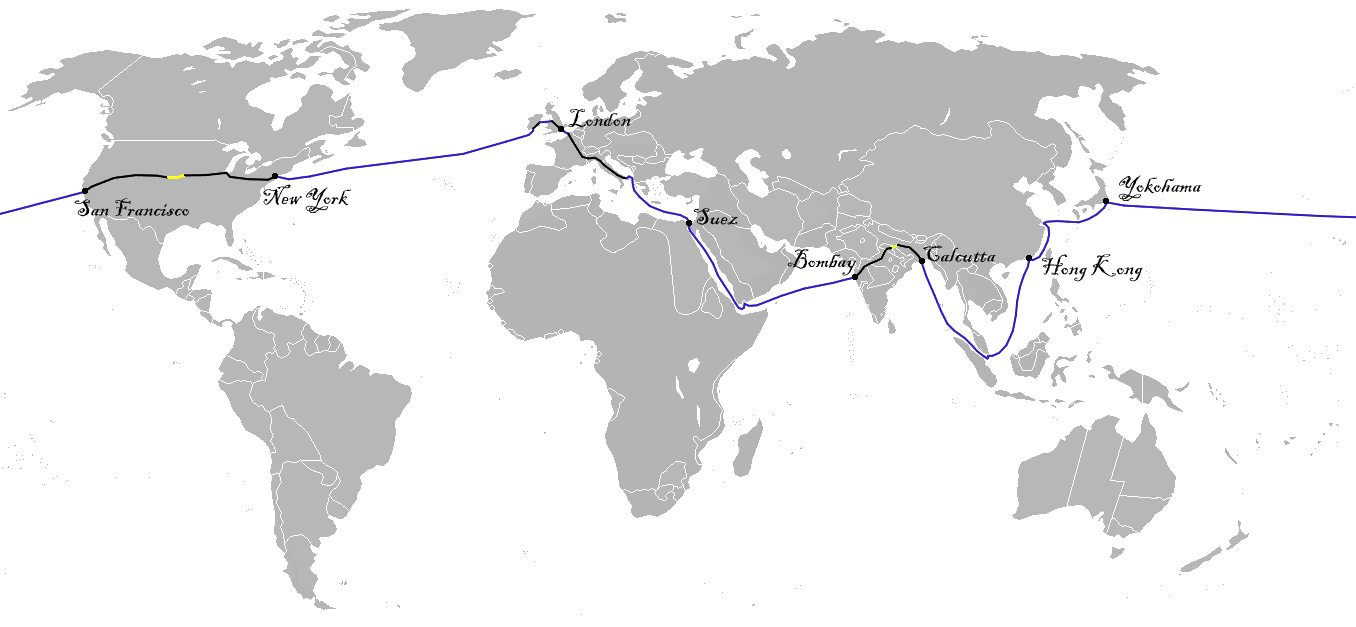 |
| Fogg's trip around the world, courtesy to Wikipedia. |
The play has many, many scenes, and unfortunately the map is unlikely to be visible from the tech booth driving it. So the interface not only needed to allow turning on the appropriate LEDs but also provide visual feedback to the technician driving it. Also, experience with the software running our stage lights has told us that the "go back one light change" feature is used more than we'd like to admit, so a "back" button for the map would be great as well. As there's a network connection for the BBB, I decided to go for a web interface. The BBB already comes with some demo web pages, some of which also demo a JavaScript library called bonescript. That was what I wanted to use as well.
However, on closer inspection it turned out that bonescript was originally designed as a node.js module, and running it from the browser sometimes just didn't work right, and getting it integrated into a website that looked the way I wanted wasn't trivial either. A look at the bonescript page showed that the main use case seemed to be running from the cloud9 web-based IDE that is also shipped on the BBB image. For me, that turned out to be even less useful. Half of the time, my program refused to start up at all, and if it did, most of the time it'd refuse to terminate, forcing me to ssh into the BBB and killing the stray node.js job from the command line. Clearly, that wasn't a viable solution for our show.
But of course, bonescript being a nodejs module meant that I could simply write a node.js webapp that would then call the appropriate bonescript functions to trigger the hardware actions needed. And that's just what I did. The code is available on GitHub if you want to have a look, but basically it works like this:
A node.js application is providing an http server with a bunch of endpoints to trigger advancing the LEDs, and figuring out what travel destinations are available. The http server also serves out the UI files.
There's a separate module that keeps the list of destinations along with the pin that needs to be signaled to advance the shift register, and how many signals need to be sent per destination.
I also have a fakebonescript library that instead of talking to real hardware just prints to stdout so I could develop on my laptop instead of having to have the BBB available all the time.
On the user interface side of things, I use KnockoutJS to keep track of the world map state and handle user interface updates. KnockoutJS also comes with a simple templating system that allows me to build the UI for the travel destinations dynamically. For layouting, I use Twitter's Bootstrap framework. This allows me to build a simple UI with all the required "travel", "back" and "clear" buttons in less than 100 lines of custom HTML and JavaScript code.
For a total of slightly under 350 lines of code I had to write myself, I've got a BeagleBone Black running ~150 LEDs that light up to show the route Phileas Fogg and his servant Passepartout travel around the world, and the total hardware cost of the setup is less than 100 EUR if I also count the BBB that will be reusable for other projects. I'm still amazed myself how nice and easy it is to do really cool electronic projects these days.

